Research Article 
 Creative Commons, CC-BY
Combined in Silico and Experimental Research to Test the Possible Immunogenicity of a New Complex Biologic Medical Drug (PRS CK STORM)
*Corresponding author:Juan Pedro Lapuente, R4T Molecular and Cell Biology Research Laboratories, Fuenlabrada Hospital, Madrid, 28942, Spain.
Received: April 11, 2022; Published: May 11, 2022
DOI: 10.34297/AJBSR.2022.16.002212
Abstract
Treatments with biological medicines tend to have a relative efficacy that decreases mainly for two reasons. Firstly, drugs based on the use of high doses of proteins, especially those manufactured artificially or semi-artificially by biotechnology, tend to produce immunogenicity reactions and generate Antidrug antibodies (ADAs) in a certain percentage of the patients to whom they are applied. Secondly, a therapeutic approach based on the single use of a monoclonal antibody does not cover possible positive or negative feedback mechanisms in parallel associated metabolic pathways. Our research group has developed a new biotechnological platform that allows the production of complex biological drugs for allogeneic use, based on the generation of macrophage co-culture with stromal cells or primary cells, with indirect contact. This article describes the in silico, in vitro and in vivo tests carried out with the drug PRS CK STORM, a conditioned medium of M2 macrophages produced by co-culture with indirect contact with MSCs from fat, the results of which demonstrate the absence of immunogenicity of the product applied at the doses tested, demonstrating the possible safety of the drug.
Keywords:Coculture; M2 macrophages; Mesenchymal Stem Cells (MSC); PRS CK STORM; Immunogenicity; Antidrug Antibodies (ADAs)
Introduction
Immunogenicity is defined as the ability of a substance to induce a specific humoral or cellular immune response and is the result of differences in the three-dimensional structure of any exogenous molecule versus its own proteins [1]. Antibodies or immunoglobulins are glycoproteins secreted from plasma cells or B lymphocytes, which are part of the adaptive immune system. There are several types of immunoglobulins depending on their molecular structure and functions, such as IgM, IgG, IgA, IgE and IgD, but it is the IgG antibodies that account for most of the immune protection against exogenous drugs.
All biological drugs, even those of purely human origin, can be recognized by the immune system of the patient undergoing treatment as foreign structures and become antigens, which can lead to the formation of antibodies against the drug, called ADA (Anti-Drug Antibody) [2]. This type of immune response can, at best, lead to a lack of therapeutic efficacy of the biological drug in a certain percentage of patients, due to a reduction in therapeutic exposure, and in the worst case, even to an anaphylaxis reaction [3,4]. To realize the importance of the potential immunogenicity of biologic drugs, one only must look at the standards imposed by both the Food and Drug Administration (FDA) [5] and the European Medicines Agency (EMA) [6] in this regard.
The immune response against biologic drugs is usually T-lymphocyte-dependent, but there are also T-independent pathways [7,8]. In any case, once the biologic drug is introduced into the patient’s body, the immune response will initially be expressed through an increase in the low affinity immunoglobulins of the acute response, i.e., through an initial increase in IgM. This initial response through an increase in IgM will, within days, give way to a response through an increase in IgG. This immunoglobulin has 4 subtypes, IgG1, IgG2, IgG3, and IgG4. The latter, together with IgG2a, is the most frequently associated with the loss of efficacy of a biological drug due to loss of exposure to the drug, and its levels in blood are directly related to the formation of ADA against biological drugs [9-12]. In fact, this immunological reaction of ADA generation, based on increased IgG4 levels in the blood of the treated patient, has been frequently seen in treatments based on the use of monoclonal antibodies against TNF-α [2]. Days after the immune response against the biologic drug has been generated through an IgM and/or IgG (mainly IgG4) immunoglobulin response, if the stimulus is maintained by prolonged administration of the drug, B lymphocytes will mature and produce plasma cells that will generate ADAs against the biologic drug. Importantly, proteinbased drugs can lead to accelerated maturation of these B cells and thus to earlier and greater production of ADAs against the drug.
Our drug PRS CK STORM is a conditioned M2 macrophage medium produced by indirect contact co-culture of M2 macrophages from donor monocytes with fat Mesenchymal Stem Cells (MSCs) also from different donors. The intended use of PRS CK STORM is to treat cytokine storm associated with moderate to severe infectious processes, including that associated with COVID-19, by intravenous administration. It is therefore considered an allogeneic biological medicinal product composed primarily of human proteins, mainly cytokines, chemokines, and growth factors. As these are low molecular weight human proteins, and furthermore used at low doses (doses in the order of 106 picograms are applied), the principle of self-tolerance would be applicable in this case; this principle suggests that human proteins should not provoke an immune response. But this may not be the case, as there is a history of immune reactions via T-lymphocytes to autologous proteins used in the treatment of diabetes [13,14] and multiple sclerosis [15,16]. Therefore, the potential immunogenicity of the product must be predicted by in silico studies combined with in vitro studies, and then in vivo assays.
Currently, the gold standard for in silico prediction of immunogenicity is the use of machine learning algorithms. Machine learning methods convert collected input data into useful information by being able to predict future responses for future variables, and by constantly cross-checking newly obtained data, exploring the relationships between the process and the input and output variables. Machine learning approaches used in in silico analysis fall into two main categories: supervised learning and unsupervised learning. In supervised learning, we need “training data”, which are pairs of input and output variables, from which the system “learns”. Some of the most common algorithms used in supervised learning are linear regression, partial least squares, neural networks, support vector machines and random forests.
In the specific case of the PRS CK STORM, we chose to apply a simple system of sequence alignment algorithms [17], first of the complete coding sequences of the selected cytokines, and then only of the exons, which compare two or more sequences trying to find similarities between them, both structural, functional and evolutionary, in order to predict possible immunogenicity, given that the process of planned in vivo studies included treating two different animal species (rat and pig) with a conditioned medium of human origin.
Since such a system is prone to errors [18], an in vitro assay to study the metabolic activity of human, rat, and pig macrophages of the MTT (3-(4,5-dimethylthiazol-2-yl)-2,5-diphenyltetrazole bromide) type was proposed.
Once the possible absence of immunogenicity was verified in the in silico and in vitro tests, the PRS CK STORM drug was administered at repeated doses for 14 days, to definitively verify the existence or not of immunogenicity of the drug in any of the two species.
Materials and Methods
In-Silico Multiple Sequence Alignment (MSA) Research
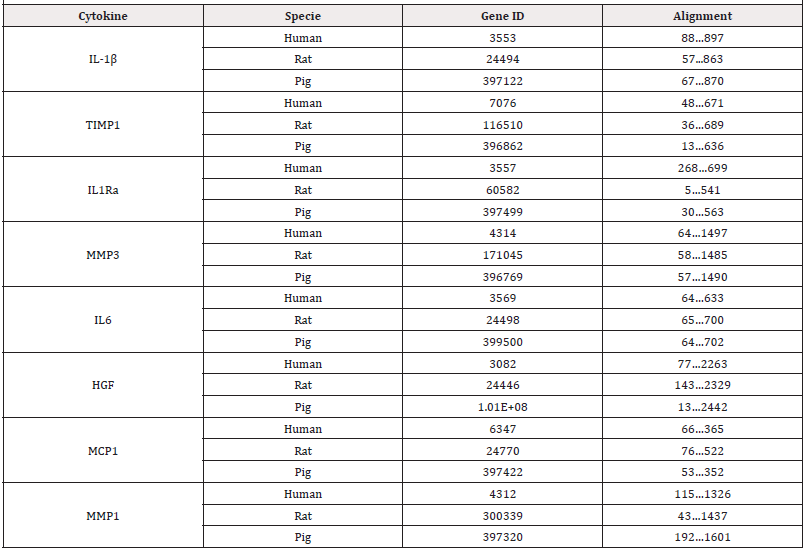
The Gene database, a resource of the National Center for Biotechnology Information (NCBI) that centralizes gene-related information in individual records, was used as a source to extract the complete genes of the eight cytokines from the 3 species (human, pig, and rat). The genomes of the following cytokines primarily quantified in 7 different batches of PRS CK STORM produced (IL- 1β, TIMP-1, IL-1Ra, MMP-3, IL-6, HGF, MCP-1, MMP-1) in 3 different species (human, rat, and pig) were selected. Table 1 lists both the studied genes identified in the NCBI gene database and the studied alignments.
Subsequently, the in-silico technique of multiple sequence alignment of the complete cytokine genes was applied in silico following a Progressive Alignment Method (MSA) with the Clustal W software [19] (https://www.uniprot.org) to compare the alignment of the bases of the three complete genes encoding each specific cytokine in each species. The applied multiple alignment algorithm consists of three main steps. Firstly, all pairs of sequences are aligned separately to calculate a distance matrix giving the divergence of each pair of sequences, secondly a guide tree is calculated from the sequence matrix, and finally, they are progressively aligned according to the branching order in the guide tree [19]. Next, the in silico multiple sequence alignment technique was applied following a Progressive Alignment Method (MSA) with Clustal Omega software (https://www.ebi.ac.uk/Tools/ services/web_clustalo/toolform.ebi) to compare the alignment of only the bases of the exons of the three genes encoding each specific cytokine in each species [20]. Subsequently, the functional conservation patterns of GO Biological Processes annotations based on computational techniques were analyzed according to the electronic annotations against the percentage of sequence similarity [20].
Production of PRS CK STORM
For the present study, the production of PRS CK STORM was used, whose complete production process is described in full and in detail in Lapuente et al. [21].
MTT Assay (3-(3,4 -dimethylthiazol-2- thiazolyl)-2,5- diphenyltetrazolium bromide)
To test the possible in vitro immunogenicity reaction, an MTTtype assay was performed on macrophage-transformed THP-1 cells by adapting the method of Chen et al. [22]. Differentiated THP-1 cells were washed three times with 0.2mL of tempered THP-1 medium without PMA and allowed to stand for 30min before LPS stimuli. After the cell medium change, cells were treated with 10ng/mL LPS (Sigma-Aldrich, Burlington, MA, USA) in RPMI 1640 medium and treated with 100μL of PRS CK STORM or the control defined above by adding tempered THP-1 medium to obtain 200μL of cell culture per well. Three wells were seeded with THP- 1m cells only, three were seeded with THP-1m cells stimulated with LPS at a concentration of 10ng/mL, three were seeded with THP-1m cells stimulated with LPS at a concentration of 10ng/mL and PRS CK STORM at a low dose, three were seeded with THP- 1m cells stimulated with LPS at a concentration of 10ng/mL and PRS CK STORM at a medium dose, three were seeded with THP- 1m cells stimulated with LPS at a concentration of 10ng/mL and PRS CK STORM at a high dose, and finally, as controls, three were seeded with THP-1m cells stimulated with LPS at a concentration of 10ng/mL and hydrocortisone at 10μg/mL (Sigma-Aldrich,PRS CK STORM were calculated as a function of TIMP-1 content in the conditioned medium (low at 594.86pg total TIMP-1, medium at 1189.72pg TIMP-1 and high at 5948.6pg TIMP-1). After incubation of all cultures for 96 hours, 10μl/well of an aqueous solution (5mg/ ml) of tetrazolium blue (Sigma-Aldrich, Burlington, MA, USA) is added. The MTT/tetrazolium blue solution is incubated for 4 hours at 37°C, 5% CO2, after incubation the plates are centrifuged at 600g, for 7 minutes to precipitate the cells and formazan crystals, and after removal of the medium the formazan crystals are solubilized by adding 200μL/well of DMSO. The plates are incubated at 37°C for 10 minutes and shaken at 250rpm using a plate shaker (JP Selecta, Abrera, Catalonia, Spain). Results are obtained by measuring the absorbance of each well at 570nm on an iMark plate reader (BioRad, Hercules, California, USA).
In-vivo immunogenicity test under GLP (Good laboratory practice) conditions
Two animal species were used for the in vivo immunogenicity study of PRS CK STORM. First, 8-week-old Rattus Norvegicus us rats of the Sprague Dawley strain from the supplier ENVIGO (Indianapolis, IN, USA) and housed and treated at the Vivotecnia facility were used. Secondly, 5-month-old minipigs of the Göttingen strain from the supplier Ellegaard (Dalmose Denmark) housed and treated at Vivotecnia under GLP conditions were used (see appendix 1 for GLP certification of the Vivotecnia laboratory).
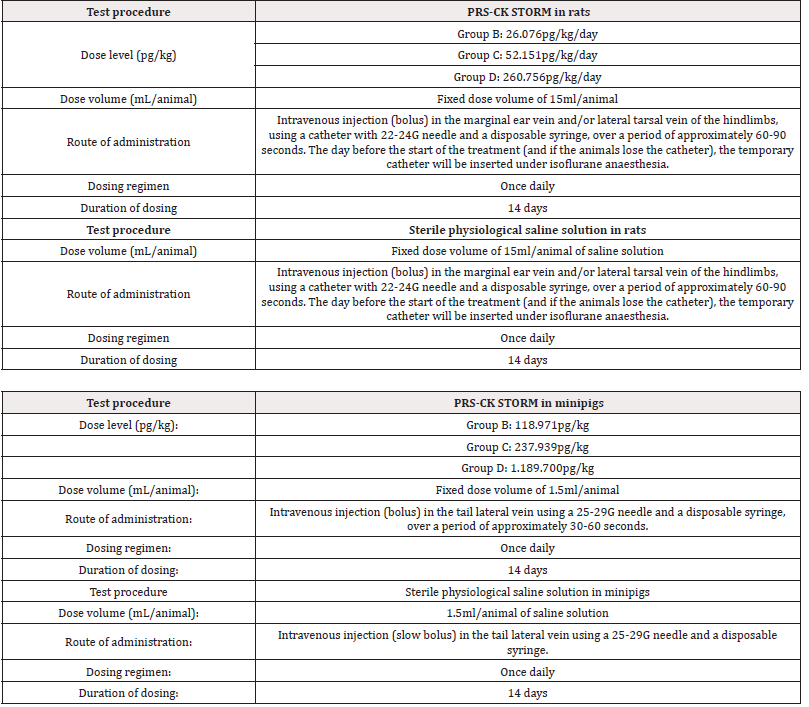
Initially 140 rats, 70 females and 70 males and 40 minipigs, 20 females and 20 males, were used and randomized into 4 groups in two allocations (main and recovery). All animals were dosed intravenously with PRS CK STORM or vehicle treatment (sterile physiological saline) once daily for 14 days and all animals in the recovery group had a 14-day period without treatment. Details on dosing and administration of PRS CK STORM in both species are given in Table 1A & 1B.
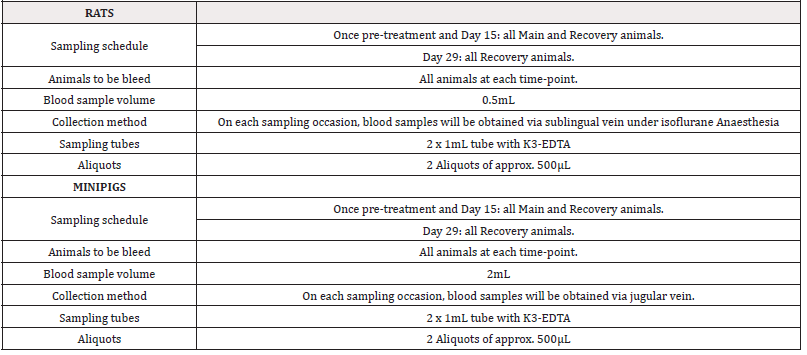
For rats, each main group comprised 20 male and 20 female rats. Group A and Group D included 4 additional animals per sex (recovery animals) that were kept for an additional 2 weeks of recovery at 14 days of treatment. Animals treated with sterile physiological saline were assigned to Group A and animals treated with PRS CK STORM at three different doses were assigned to Group B, C and D. As for the minipigs, each main group consisted of 4 male and 1 female minipig. Groups A and D included 2 additional animals per sex (recovery animals), which were retained for an additional 2 weeks of recovery at 14 days of treatment. As in the rats, animals treated with sterile physiological saline were assigned to Group A and animals treated with PRS CK STORM at three different doses were assigned to Group B, C and D. Table 2 shows the allocation of animals in each group. For immunogenicity analysis, blood samples were collected as indicated in Table 3.
Blood samples from both species were collected, for rats in a 500μL Microvette® with citrate and for minipigs in a 2mL tube with K3-EDTA. Immediately the unclothed blood was centrifuged at room temperature (25 ± 3°C) at 1500G for 10 minutes to obtain plasma. Plasma samples were collected in a separate tube and centrifuged under refrigeration a second time at 600G for 5 minutes. Plasma was carefully and completely collected by excluding the pellet from the bottom of the tube. Two aliquots of isolated plasma (200μL for rats and 500μL for minipigs) were stored frozen at -80°C ± 10°C until analysis. For immunogenicity analyses, all samples were thawed on ice and after extraction of the amount needed to perform the determinations, the samples were immediately stored in the freezer at -80°C once used. In the case of rats, the method chosen for the determination of immunoglobulin variation was the Multiplex quantification with the ProcartaPlex Rat Antibody Isotyping Panel 6 plex kit (Ref: EPX060-30123-901) from ThermoFisher Scientific (ThermoFisher Scientific, Waltham, Massachusetts, USA, strictly following the manufacturer’s instructions.
The immunoglobulins quantified were IgA, IgG1, IgG2a, IgG2b, IgG2c and IgM. Samples were analyzed in duplicate on a Luminex 200 instrument with Exponent 4.3 software (both from Luminex). In total, 7 96-well plates were used, with 40 duplicate samples per plate together with the 16 standards. In the case of minipigs, since no similar kit was available, a simple ELISA technique was chosen, also using 96-well plates, with 40 duplicate samples per plate together with the 16 standards. Samples were diluted in assay buffer which for each of the three protocols consisted of PBS + 1% bovine serum albumin (BSA fraction V; Pan Biotech, cat. no.: P06-1391100) (Aiden Bach, Germany) filtered through a 0.22μm filter. Samples were diluted to 1:5000 for IgA, being minority immunoglobulins, and 1:50000 for IgM and IgG. Prior to the assay, 96-well maximum adsorption polystyrene plates were seeded with 100μl per well of a solution of PBS + HRP (Horse Radish Peroxidase)-conjugated goat anti-porcine IgG capture antibody (AAI48; Bio-Rad, Hercules, CA, USA), HRP-conjugated goat anti-porcine IgM capture antibody (AAI41; Bio-Rad, Hercules, CA, USA), and HRP-conjugated goat antiporcine IgA capture antibody (AAI40; Bio-Rad, Hercules, CA, USA) at dilution 1: 500.
These plates were incubated for 16 hours at 4°C to allow adsorption of the antibody to the plate surface. After the incubation period, the plates were washed 3 times with PBS +0.05% Tween20 (CAS No.9005-64-5, Sigma-Aldrich, Burlington, MA, 01803 USA), with a 1min rest after each wash. After the time had elapsed, the plates were vigorously inverted and any remaining liquid in the wells was removed by lightly blotting on absorbent paper. Subsequently, 200μl of assay buffer was added to all wells to block non-specific epitopes. This solution was incubated at 37°C with gentle agitation for 2 hours. After this incubation the plates were ready for the addition of samples and standards. 100μl per well of the samples were added at the dilutions established above (IgG 1:50000, IgM and IgA 1:5000). For IgG samples, the purified pig IgG standard (PPP012; Bio-Rad, Hercules, CA, USA) was used at a dilution of 50ng/ml and from this, serial 1:1 dilution was made until a minimum dilution of 0.78ng/ml was obtained. For IgM samples, the IgM standard contained in the Deltaclon kit (NBP3-12525; Novus Biologicals, CO, USA) was used at a dilution of 1000ng/ml and from this dilution, serial dilutions of 1:2 were performed until a minimum dilution of 1.37ng/ml was obtained. For IgA samples, Deltaclon purified pig IgA standard (20017-4-1; Novus Biologicals, CO, USA) was used at a dilution of 400ng/ml and from this dilution serial dilutions of 1:2 was performed until a minimum dilution of 6.25ng/ml was obtained. Once the samples and standards were added, the plates were incubated for 1 hour at 37°C with gentle shaking. A 3-pass wash was performed again, following the same protocol as the previous wash, and then a solution of the detection antibody (AAI40P, AAI41P and AAI48P) conjugated to HRP in assay buffer was added at a ratio of 1:30000. Of this solution, 100μl per well was added. This solution was incubated for 30 minutes at 37°C with gentle agitation. The same wash as above was repeated, but in this case 4 times. Once the last wash was completed, 100μl per well of the HRP substrate solution was added and the reaction proceeded until colour was observed in the last of the standard wells (5 minutes). After this time the reaction was stopped by adding 100μl per well of a 2N Sulphuric Acid solution and the absorbance was measured at 450nm with correction at 595nm with the iMark plate reader (BioRad, Hercules, CA, 94547 USA).
Statistics
The MTT assay and the immunoglobulin quantification assay were subjected to statistical analysis. Statistical analysis was performed with Excel (Microsoft, Albuquerque, New Mexico, USA). All statistics were calculated using data from independent experiments in triplicate. ANOVA test was performed to determine statistically significant differences between the experimental groups studied using GraphPad Prism software version 8.4.0 for Mac OS X (GraphPad Software, San Diego, California, USA) to perform the calculations. The level of statistical significance was set at p < 0.05.
Results
In-silico Multiple Sequence Alignment (MSA) research
(See supplementary material Table S1 and Table S2). The average sequence similarity expressed as a percentage of RAT exons encoding RAT cytokines to human exons encoding human cytokines is 75.15%. The average sequence similarity expressed as a percentage of PIG exons encoding PIG cytokines to human exons encoding human cytokines is 84.5%.
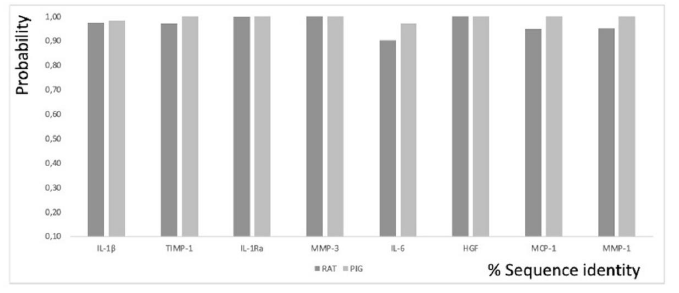
Figure 1: Functional conservation patterns for GO Biological Processes annotations based on computational techniques such as electronic annotations, versus the percentage of sequence similarity in RAT and PIG cytokines with respect to the same human cytokines. Quantitative assessment of the relationship between sequence similarity and function similarity.
The sequence similarity expressed in percentage of ARP exons encoding IL-1β with respect to human exons encoding the same human cytokine is 75.25%, ARP exons encoding TIMP-1 with respect to human exons encoding the same human cytokine is 77.72%, ARP exons encoding IL1Ra with respect to human exons encoding the same human cytokine is 79 81%, ARP exons encoding MMP-3 from ARP to human exons encoding the same human cytokine is 81.15%, ARP exons encoding IL-6 from ARP to human exons encoding the same human cytokine is 60.14%, ARP exons encoding HGF from ARP to human exons encoding the same human cytokine is 80. 14%, RAT exons encoding MCP-1 from RAT to human exons encoding the same human cytokine is 67.67%, and finally, RAT exons encoding MMP-1 from RAT to human exons encoding the same human cytokine is 71.49%. The sequence similarity expressed as a percentage of PIG exons encoding IL-1β from PIG to human exons encoding the same human cytokine is 76.09%, PIG exons encoding TIMP-1 from PIG to human exons encoding the same human cytokine is 88 12%, PIG exons encoding IL1Ra from PIG to human exons encoding the same human cytokine is 86.11%, PIG exons encoding MMP-3 from PIG to human exons encoding the same human cytokine is 84, 65%, PIG exons encoding IL-6 from PIG to human exons encoding the same human cytokine is 75.04%, PIG exons encoding HGF from PIG to human exons encoding the same human cytokine is 92.77%, PIG exons encoding IL-6 from PIG to human exons encoding the same human cytokine is 92.77%, PIG exons encoding HGF from PIG to human exons encoding the same human cytokine is 92.77%, PIG exons encoding PIG MCP-1 to human exons encoding the same human cytokine is 84.33%, and finally, PIG exons encoding PIG MMP-1 to human exons encoding the same human cytokine is 88.86% (Figure 1).
MTT Assay
The results of the MTT test show no statistically significant increase in MTT reduction, so the test shows no change in cell metabolism in THP-1m cells, as expected from previous results observed in the in-silico study (Figure 2).
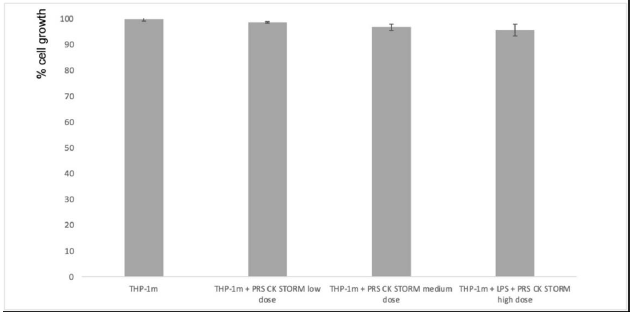
Figure 2: Estimation of cell growth using the MTT reduction method. Left bars: PBMCs from two different donors (A) or THP-1 cells (B) were cultured for 96 hours in either the presence or absence (as indicated) of a high dose of PRS CK STORM, and MTT reduction was determined. Right bars: PBMC (A) or THP1 cells (B) were stimulated with 100pg/mL or 10ng/mL, respectively, for 96 hours and cultured during this time in either the presence or absence (as indicated) of 10μg/ml HC or with different doses of the secretome. The doses were low (x1), medium (x2.5), or high (x5). Data are expressed as percentage of cell growth compared with untreated control cells in each case and represent the mean ± SD of two experiments performed in triplicate: *, p-values < 0.05.
In vivo Immunogenicity Test under GLP (Good Laboratory Practice) Conditions
First, the results of in vivo tests on 140 rats treated with PRS CK STORM at 3 different dosages were analyzed. Figure 3 shows the results of the analysis of the 3 immunoglobulins studied.
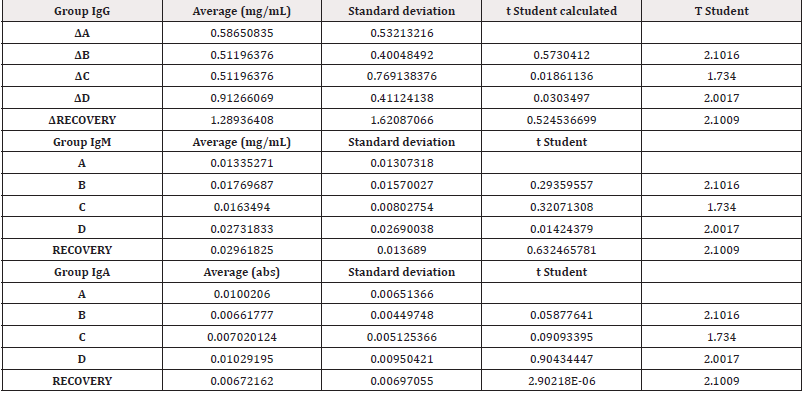
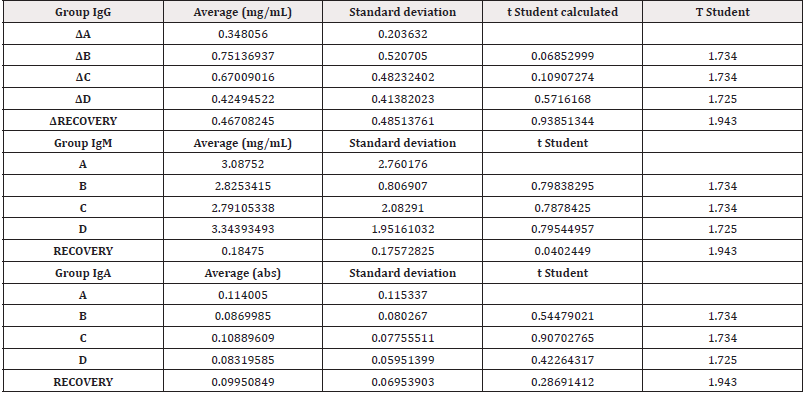
Table 4 shows the means of the differences found in the values of the different immunoglobulins studied, both at the end of treatment and those found in the recovery groups 14 days after the end of treatment, together with their standard deviations, as well as the result of the comparative analysis using Student’s t-test to evaluate the possible existence of statistically significant differences. Complete data for all determinations in all test animals are available in (Table S3) of the supplementary material.
Secondly, the results of in vivo tests on the 40 minipigs treated with PRS CK STORM at 3 different dosages were analyzed. Figure 4 shows the results of the analysis of the 3 immunoglobulins studied. Table 5 shows the means of the differences found in the values of the different immunoglobulins studied, both at the end of treatment and those found in the recovery groups 14 days after the end of treatment, together with their standard deviations, as well as the result of the comparative analysis using Student’s t-test to evaluate the possible existence of statistically significant differences. Complete data for all determinations on all animals tested are available in Table S3 of the supplementary material.
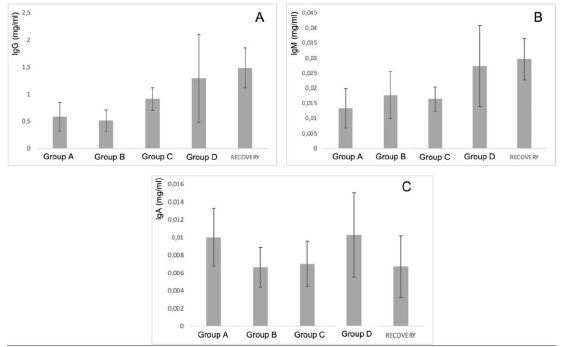
Figure 3: Figure 3A: average, standard deviation and significancy in the values of IgG after subtracting the Predose value of the value of the sample on day 15 in all groups. For the recovery group the difference corresponds to Day 29 in comparison to Predose for recovery animals Group D. No group shows statistically significant differences; The differences in the group D come from only 4 individuals that alter the overall mean (31, 71, 72 and 74). Figure 3B: average, standard deviation and significancy in the values of IgM after subtracting the Predose value of the value of the sample on day 15 in all groups. For the recovery group the difference corresponds to Day 29 in comparison to Predose for recovery animals Group D. No group shows statistically significant differences. Figure 3C: average, standard deviation and significancy in the values of IgA after subtracting the Predose value of the value of the sample on day 15 in all groups. For the recovery group the difference corresponds to Day 29 in comparison to Predose for recovery animals Group D. No group shows statistically significant differences.
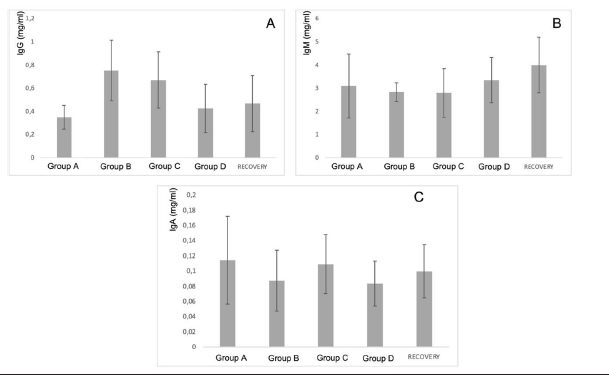
Figure 4: Figure 4A: average, standard deviation and significancy in the values of IgG after subtracting the predose value of the value of the sample on day 15 in all groups. For the recovery group the difference corresponds to Day 29 in comparison to predose for recovery animals Group D. No group shows statistically significant differences; The differences in the group D come from only 4 individuals that alter the overall mean (31, 71, 72 and 74). Figure 4B: average, standard deviation and significancy in the values of IgM after subtracting the predose value of the value of the sample on day 15 in all groups. For the recovery group the difference corresponds to Day 29 in comparison to predose for recovery animals Group D. No group shows statistically significant differences. Figure 4C: average, standard deviation and significancy in the values of IgA after subtracting the predose value of the value of the sample on day 15 in all groups. For the recovery group the difference corresponds to Day 29 in comparison to predose for recovery animals Group D. No group shows statistically significant differences.
Discussion
Regarding the in-silico tests performed to predict a possible immunogenicity reaction, we must remember that we are using a protein production system that is eukaryotic, and as there are no sequence differences (human to human) it should not cause immunogenicity.
The application of sequence alignment algorithms for antigen identification is problematic for several reasons and can produce ambiguous results or fail. For example, some proteins that have no obvious sequence similarity and that are formed through evolution (divergent or convergent), may share similar properties and structure [18]. In addition, in some cases antigenicity (as a property) may not be available for direct identification. However, by aligning the exons using BLAST (Basic Local Alignment Search Tool) the exons are conserved in a very high percentage, which shows that these proteins would maintain the same function regardless of the species to which it belongs, so that a priori these cytokines would not be recognized as foreign unless administered at very high doses. These alignments also coincide with the protein alignments, and they also show that the functional regions are highly conserved. As can be seen in Figure 2, the sequences of the exons of the genes encoding the cytokines studied in rats and pigs are similar in function and sequence to the exons of the genes encoding the same human cytokines, so no interspecies immunological reactions are to be expected [23].
Another aspect to discuss regarding the prediction of the possible immunogenicity of PRS CK STORM is that the doses at which it is used, even at the highest dose, the cytokines we have in PRS CK STORM, as well as all the other components, are usually at a higher concentration in human plasma, i.e., there is not going to be a large increase in these factors. In all cases where immunogenicity/ADAs have been reported in the literature, these are cases where either an exogenous protein (produced in another non-eukaryotic system) or a protein at doses much higher than those found in plasma was being used, and circumstance results in immunogenicity [24].
MTT can be related to product immunogenicity because if any of the factors present in PRS CK STORM were recognized as exogenous or antigenic, THP-1m cells would react to these factors, increasing their metabolism and therefore giving higher MTT reductions compared to the untreated control, and as seen in the results, this has not occurred [25].
The immunoglobulin concentrations found in the samples analyzed in rats were lower or similar to the range of concentrations reported in the literature [26], except for the IgM level in animals 3, 5, 6, 7, 8, 10, 12, 13, 14, 15, 17, 18, 19, 20, 21, 22, 23, 24, 24, 25, 25, 26, 28, 30, 31, 36, 37, 38, 39 and 40. The differences in concentrations could be due to experimental variations that do not affect comparisons between individuals or groups studied. According to the results obtained in this study, no individual from any group has been found to show increases in immunoglobulin concentration higher than those found in the control group (A), which was injected with vehicle. Most animals in all groups showed no statistically significant differences when intra-individual increases of each immunoglobulin normalized in percentage were analyzed in relation to the normalized percentage changes observed in group A at 15 days. Notably, two animals in group B (ID5 [74.27%] and ID7 [50.09%]), two animals in group C (ID9 [44.27%] and ID11 [91.05%]) and three animals in group D (ID13 [47.33%], ID14 [44.88%] and ID35 [48.72%]) showed an increase in IgG normalized to percentage with statistically significant differences compared to the maximum normalized difference observed in group A.
When we analyzed the differences of the intra-individual percentage-normalized increases of each immunoglobulin in relation to the normalized percentage variations observed in group A at 29 days, we found that one animal in the high-dose D-recovery group (ID36 [51, 11%]) showed an increase in IgG and three animals in the high-dose D-recovery group (ID35 [168.76%], ID36 [364.57%] and ID39 [194.59%]) showed an increase in IgM normalized to percentage with statistically significant differences compared to the maximum normalized difference observed in group A. For IgA, no significant differences were found between the control and treatment groups at 15 and 29 days. Furthermore, when the variability of IgG, IgA and IgM concentration by groups was statistically analyzed, no significant differences (p<0.05) were found between the control group and the rest of the groups, so that the results in general do not seem to respond to an immunological reaction to the injected product.
The immunoglobulin concentrations found in the samples analyzed in the minipigs (Table S4 of the supplementary material) were lower than the range of concentrations reported in the literature, except for the IgA level. The differences in concentrations could be due to experimental variations that do not affect comparisons between individuals or groups studied. According to the results obtained in this study, no individual in groups B and C (low and medium dose) was found to have increases in immunoglobulin concentration higher than those found in the control group (A), which was injected with vehicle. In contrast, an increase in IgG was detected in only 4 individuals (ID numbers 31, 71, 72 and 74), all from the highest dose group (D), including the individuals in the Recovery group, which means that we found an increase in 13.3% (4/30) of the individuals in group D. Of the 4 individuals with increased IgG, one was male and three were female. Individual 31 showed the highest values and was the main contributor to the mean values. Furthermore, when the variability of IgG concentration was statistically analyzed by groups, no significant differences were found (⍺=0.05) between the control group and the rest of the groups, so that the results in general do not seem to respond to an immunological reaction to the injected product. However, the values found in four animals in group D are noteworthy, which, although significantly higher than the control group, are within the values considered normal by the literature (IgG: 14.89-30.01) [27-31].
Conclusions
Given the results obtained in the different tests performed, both in silico, in vitro and in vivo, we can affirm that PRS CK STORM, a conditioned medium from indirect co-culture of M2 macrophages with MSCs, does not have the capacity to generate immunogenicity reactions (ADAs) at the doses tested.
Patents
This research work has resulted in the patent PCT/ EP2020/059365 “Composition for tissue regeneration, method of production and uses thereof”.
Supplementary Materials
The following data are available as supplementary material.
Table S1: Results MSA total gene from cytokines, chemokines,
and growth factors.
Table S2: Results MSA exons gene from cytokines, chemokines,
and growth factors.
Table S3: RAT immunoglobulins analysis.
Table S4: MINIPIG immunoglobulins analysis.
Author Contributions
All authors contributed to the study conception and design. Material preparation, data collection, and analysis were performed by Juan Pedro Lapuente, Joaquín Marco-Brualla, Gonzalo Gómez, Paula Desportes, Jara Sanz, Pablo Fernández, Marco García-Gil, Fernando Bermejo, Juan V. San Martín, Alicia Algaba, Daniel Lapuente, Almudena De Gregorio, Belén Lapuente, and Sergio Gómez. The first draft of the manuscript was written by Juan Pedro Lapuente and Alberto Anel, and all authors commented on previous versions of the manuscript. All authors read and approved the final manuscript.
Informed Consent Statement
Informed consent was obtained from all donors involved in the study.
Institutional Review Board Statement
The in vivo study was conducted in accordance with the Declaration of Helsinki in Vivotecnia research S.L. (Madrid, Spain) who has a Certificate of Good Laboratory Practice Compliance Ref: BPL I/21.10/47-CM (Annex 1).
Data Availability Statement
The datasets generated and/or analyzed during the current study are available from the corresponding authors on reasonable request.
Conflicts of Interest
Authors declare that they have no financial or personal conflicts of interest that could inappropriately influence the conduct of this research.
References
- Schellekens H (2002) Immunogenicity of therapeutic proteins: clinical implications and prospects. Clin Ther 24(11): 1720-1740.
- Van Schouwenburg PA, Rispens T, Wolbink GJ (2013) Immunogenicity of anti-TNF biologic therapies for rheumatoid arthritis. Nat Rev Rheumatol 9(3): 164-172.
- Bloem K, Hernández Breijo B, Martínez Feito A, Rispens T (2017) Immunogenicity of Therapeutic Antibodies: Monitoring Antidrug Antibodies in a Clinical Context. Ther Drug Monit 39(4): 327-332.
- Bedolla Pulido TR, Mariscal Castro J, González Mendoza T, Morales Romero J, Bedolla Barajas M (2020) Cold urticaria and risk of anaphylaxis treated with omalizumab. About a case. Rev Alerg Mex 67(4): 408-412.
- FDA (2019) Immunogenicity testing of therapeutic protein products-developing and validating assays for anti-drug antibody detection. Guidance for Industry. U.S. Department of Health and Human Services Food and Drug Administration. Center for Drug Evaluation and Research (CDER). Center for Biologics Evaluation and Research (CBER).
- EMA (2017) Guideline on immunogenicity assessment of therapeutic proteins. European Medicines Agency.
- Vultaggio A, Nencini F, Bormioli S, Silvestri E, Dies L, et al. (2021) Drug-specific Treg cells are induced during desensitization procedure for rituximab and tocilizumab in patients with anaphylaxis. Sci Rep 11(1): 12558.
- Lee JL, Linterman MA (2022) Mechanisms underpinning poor antibody responses to vaccines in ageing. Immunol Lett 241: 1-14.
- Weeraratne DK, Kuck AJ, Chirmule N, Mytych DT (2013) Measurement of anti-erythropoiesis-stimulating agent IgG4 antibody as an indicator of antibody-mediated pure red cell aplasia. Clin Vaccine Immunol 20(1): 46-51.
- Bartelds GM, Krieckaert CL, Nurmohamed MT, van Schouwenburg PA, Lems WF, et al. (2011) Development of antidrug antibodies against adalimumab and association with disease activity and treatment failure during long-term follow-up. JAMA 305(14): 1460-1468.
- Hofbauer CJ, Whelan SF, Hirschler M, Allacher P, Horling FM, et al. (2015) Affinity of FVIII-specific antibodies reveals major differences between neutralizing and nonneutralizing antibodies in humans. Blood 125(7): 1180-1188.
- Rane SS, Dearman RJ, Kimber I, Derrick JP (2022) Adaptation of an ELISA assay for detection of IgG2a responses against therapeutic monoclonal antibodies in a mouse immunization model. J Immunotoxicol 19(1): 1-7.
- Fowell D, Mason D (1993) Evidence that the T cell repertoire of normal rats contains cells with the potential to cause diabetes. Characterization of the CD4+ T cell subset that inhibits this autoimmune potential. J Exp Med 177(3): 627-636.
- Reijonen H, Novak EJ, Kochik S, Heninger A, Liu AW, et al. (2002) Detection of GAD65-specific T cells by major histocompatibility complex class II tetramers in type 1 diabetic patients and at-risk subjects. Diabetes 51(5): 1375-1382.
- Forsthuber TG, Shive CL, Wienhold W, de Graaf K, Spack EG, et al. (2001) T cell epitopes of human myelin oligodendrocyte glycoprotein identified in HLA-DR4 (DRB1*0401) transgenic mice are encephalitogenic and are presented by human B cells. J Immunol 167(12): 7119-7125.
- Keech CL, Farris AD, Beroukas D, Gordon TP, McCluskey J (2001) Cognate T cell help is sufficient to trigger anti-nuclear autoantibodies in naive mice. J Immunol 166(9): 5826-5834.
- Chowdhury B, Garai G (2017) A review on multiple sequence alignment from the perspective of genetic algorithm. Genomics 109(5-6): 419-431.
- Petsko GA, Ringe D (2004) Protein structure and function. Blackwell Publishing. London, UK.
- Thompson JD, Higgins DG, Gibson TJ (1994) Clustal W Improving the sensitivity of progressive multiple sequence alignment through sequence weighting, position-specific gap penalties and weight matrix choice. Nucleic Acids Res 22(22): 4673-4680.
- Sievers F, Higgins DG (2014) Clustal omega. Curr Protoc Bioinformatics 48: 1-16.
- Lapuente JP, Blázquez-Martínez A, Marco Brualla J, Gómez G, Desportes P, et al. (2022) Cytokine Profile and Anti-Inflammatory Activity of a Standardized Conditioned Medium Obtained by Coculture of Monocytes and Mesenchymal Stromal Cells (PRS CK STORM). Biomolecules 12: 534.
- Chen S, Sugiyama K, Inamura M, Tanaka S, Onda K, et al. (2016) Effects of insulin on pharmacodynamics of immunosuppressive drugs against mitogen activated human peripheral blood mononuclear cells. Immunopharmacol Immunotoxicol 38(5): 372-378.
- Joshi T, Xu D (2007) Quantitative assessment of relationship between sequence similarity and function similarity. BMC Genomics 8: 222.
- Van Mierlo GJ, Cnubben NH, Kuper CF, Wolthoorn J, van Meeteren Kreikamp AP, et al. (2013) The Göttingen minipig® as an alternative non-rodent species for immunogenicity testing: a demonstrator study using the IL-1 receptor antagonist anakinra. J Immunotoxicol 10(1): 96-105.
- Hernandez Y, González Pastor R, Belmar Lopez C, Mendoza G, Fuente J, et al. (2019) Gold nanoparticle coatings as efficient adenovirus carriers to non-infectable stem cells. RSC Advances 1327-1334.
- Vargas Mamani JJ (2020) Parámetros bioquímicos y sanguíneos de la rata de laboratorio (Rattus norvegicus): revisión de la literatura. Revista Médica Basadrina 14(1): 52-55.
- Goding JW (1978) Allotypes of IgM and IgD receptors in the mouse: a probe for lymphocyte differentiation. Contemp Top Immunobiol 8: 203-243.
- Inoue T (1981) Possible factors influencing the immunoglobulin M concentration in swine colostrum. Am J Vet Res 42(8): 1429-1432.
- Kojima CJ, Kattesh HG, Roberts MP, Sun T (2008) Physiological and immunological responses to weaning and transport in the young pig: modulation by administration of porcine somatotropin. J Anim Sci 86(11): 2913-2919.
- Halliwell R, Gorman NT (1989) Veterinary Clinical Immunology. WB Saunders Co. Philadelphia, USA.
- Tizard I (1982) An Introduction to Veterinary Immunology. W.B. Saunders Co., Philadelphia, USA.





 We use cookies to ensure you get the best experience on our website.